Keep your eyes on your
whole business analysis
Beautiful and real-time reports for all your modules

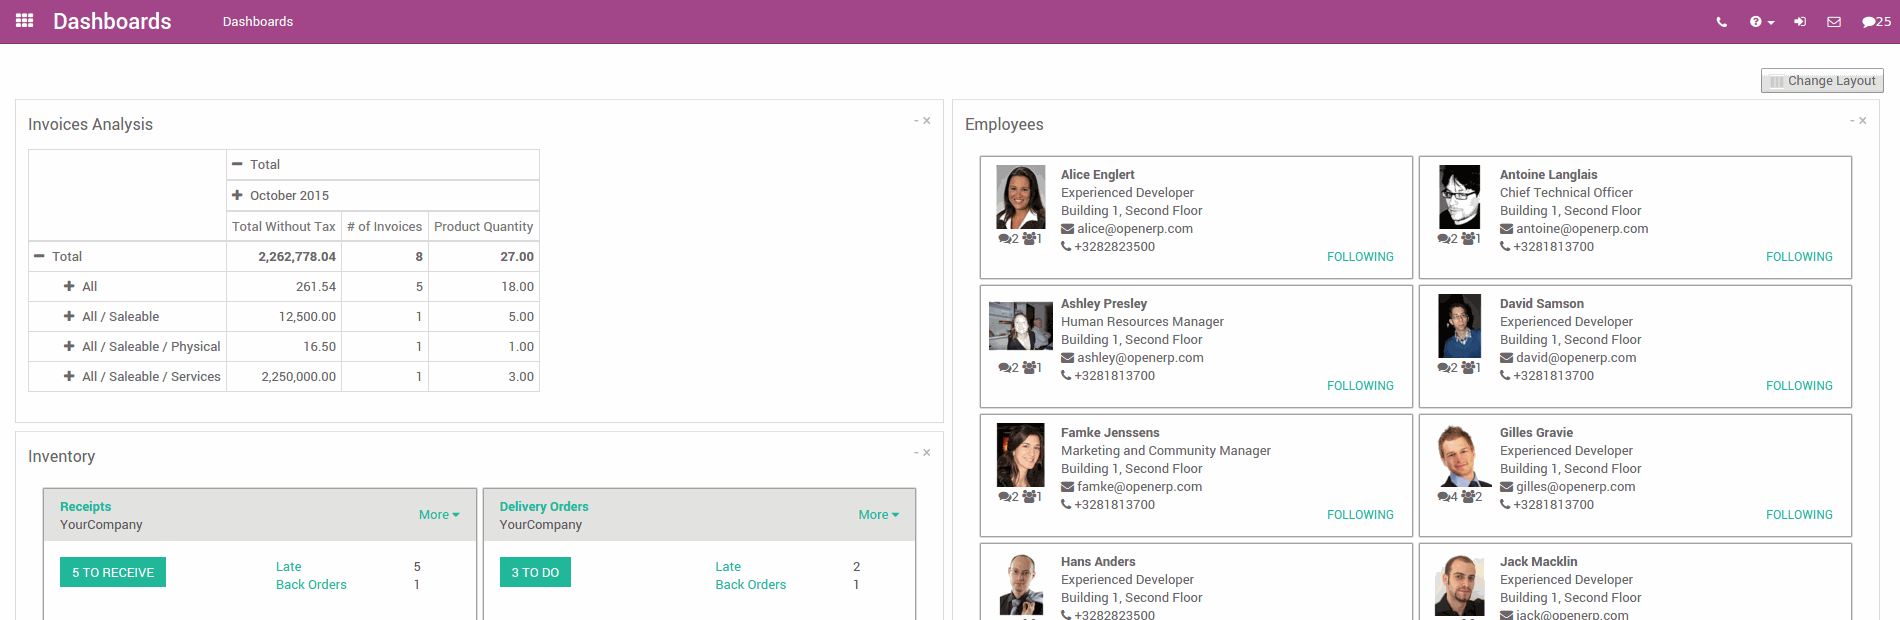
Statistics about your data
Generate graphs and charts in just a click
Create detailed reports and graphs in any format you like without the need of an external program. Get statistics on any numbers in your company, from fuel costs in projects all the way to revenues in sales teams, and with inventory, and everything in between.
Bar Chart
Pie Chart
Line Chart
The information you need the way you need it
Filter all results to fit your field of research
Filter and group each analysis using built-in filters, and create custom filters to gather only the information you are looking for. Save the filters you created in your favorites to access them anytime in just a click.
Create reports on the go
Everything at the flick of a click
Forget about exporting all your data into programs to run reports. Create specific reports and analysis on the go in a few simple clicks, based on existing templates or on personalized criteria.

Track the process
Keep track of all your important data
Track the process of each activity, from projects to reports and invoices, and get statistical information on all topics, in a simple and clear tabular chart. Get a clear overview of your whole activity and be ready for new challenges.
Fully integrated with other Odoo Apps

Inventory
Get forecasts of product availabilities based on confirmed sales orders, purchase orders or manufacturing orders as well as internal moves.

E-commerce
Find the best customers and products and highlight your monthly sales.

Sales
Obtain meaningful information about supplier invoices.

Projects
Enable your project right way. Step by step get work done.